In high-speed PCB design, mastering how to use Polar Si9000 to predict reflection in transmission line from impedance tolerance is critical for signal integrity. This pillar page integrates authoritative insights from industry-leading sources to help B2B engineers achieve controlled impedance manufacturing.
Understanding Reflection in Transmission Line from Impedance Tolerance

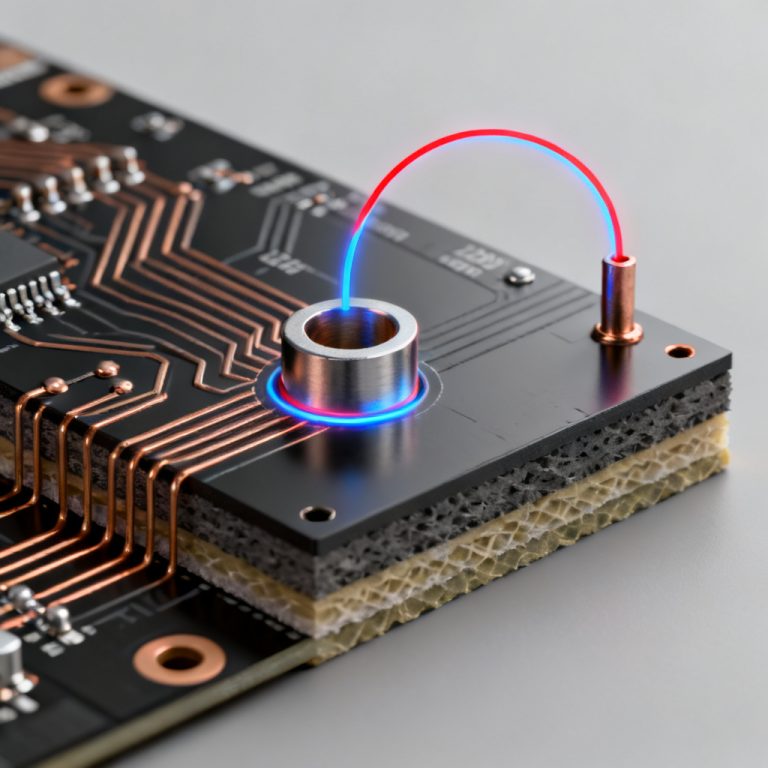
The Physics of Reflection
When a signal encounters an impedance discontinuity, a portion of the incident voltage (Vᵢ) is reflected. The reflection coefficient (Γ) is defined as: Γ = (Z_L – Z_0) / (Z_L + Z_0). Even a small impedance change, such as from 50Ω to 55Ω, produces a measurable reflection of 4.55%. This corresponds to a Voltage Standing Wave Ratio (VSWR) of 1.095.
How Impedance Tolerance Creates Reflections
In production, the actual Z₀ varies due to etching tolerances, dielectric constant (Dk) variation, and laminate thickness changes. Using Polar Si9000, you can model the worst-case impedance deviation and predict reflection amplitude. For a target of 50Ω ±10% (range: 45Ω to 55Ω), the worst-case Γ at 45Ω is 5.26%.
Using Polar Si9000 to Predict Reflection in Transmission Line: Step-by-Step Workflow
Step 1: Define the Stack-Up and Transmission Line Geometry
Open Polar Si9000 and select the appropriate structure (Microstrip, Stripline, or Differential Pair). Enter substrate parameters including Dk, Df, copper thickness, and prepreg/core thickness. Use nominal values and define tolerance ranges for each parameter.
Step 2: Run the Field Solver for Nominal Impedance
Si9000 calculates Z₀ based on physical dimensions using 2D quasi-static field solving. Record the nominal Z₀, typically 50.0Ω.
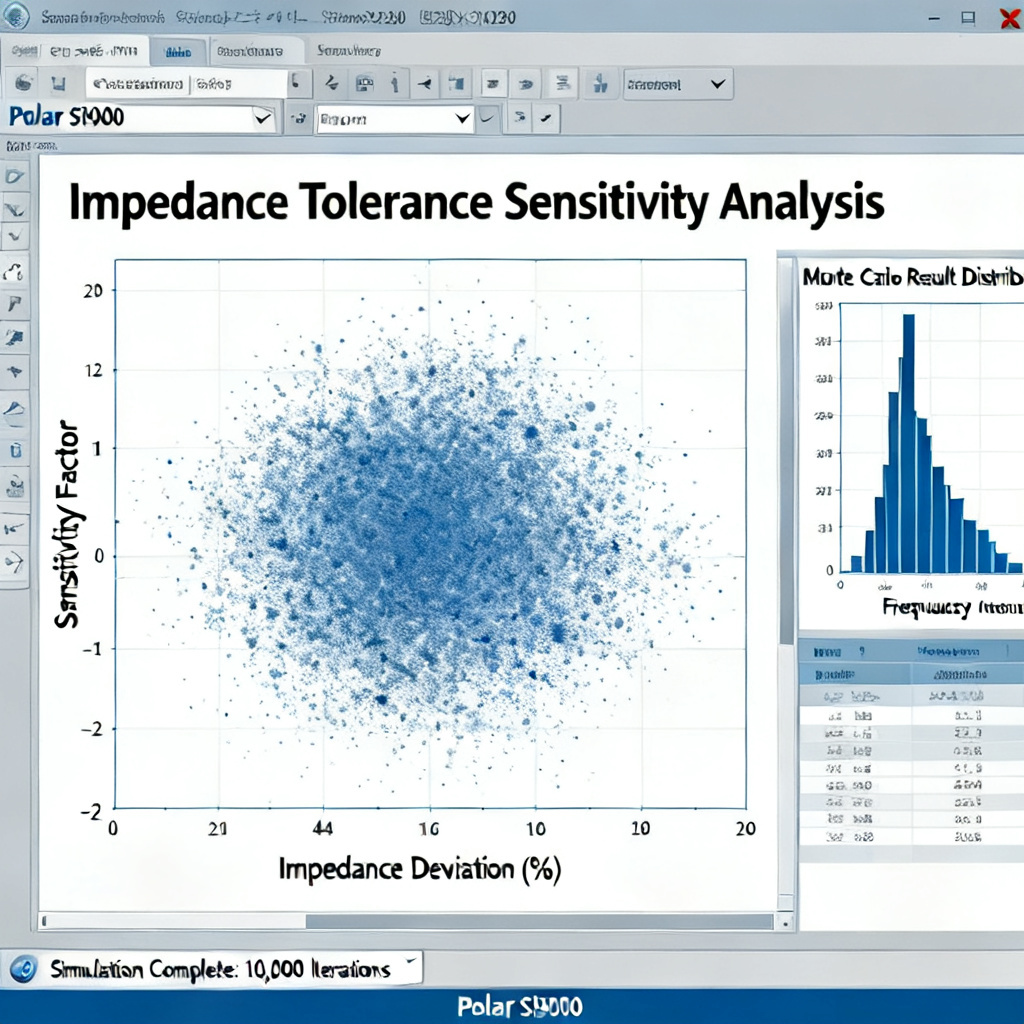
Step 3: Perform Tolerance Sensitivity Analysis
Use the “Sensitivity” or “Monte Carlo” analysis feature to vary each parameter within its tolerance range. The key output is the standard deviation (σ) of Z₀. For a typical ±10% tolerance, 3σ may span 48Ω to 52Ω.
Step 4: Calculate Reflection Coefficient from Tolerance Limits
Using the worst-case Z₀ from Step 3, compute Γ and VSWR. For example, if Z₀_min = 48Ω and Z₀_max = 52Ω, Γ_min = 2.04% and Γ_max = 1.96%.
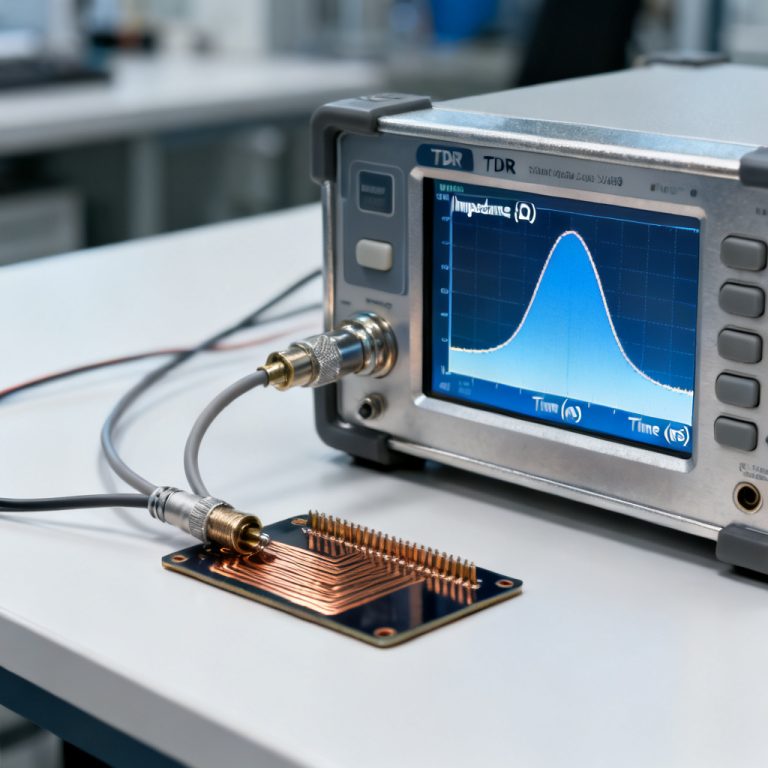
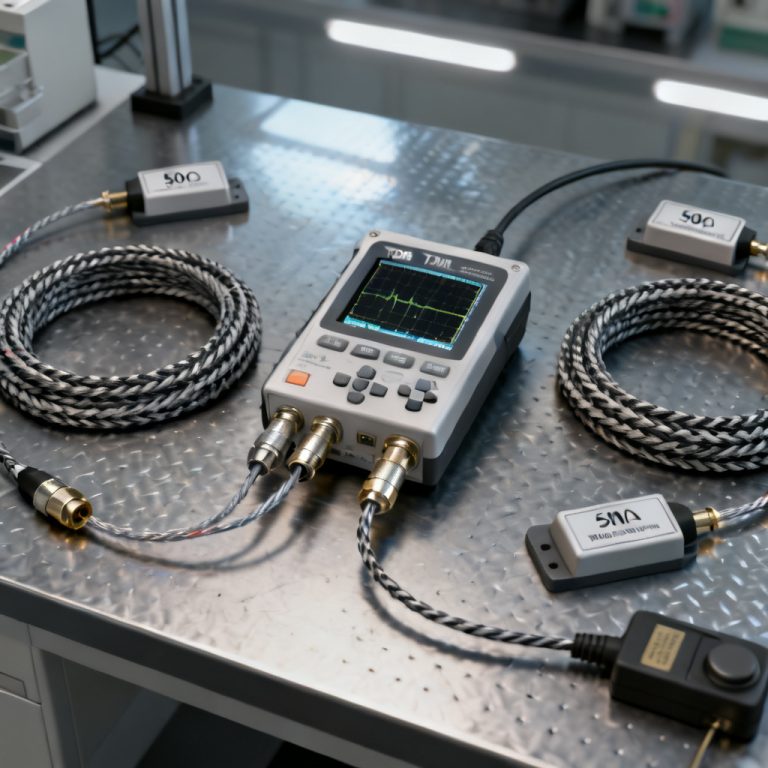
Advanced Prediction: Time Domain Reflectometry (TDR) Correlation
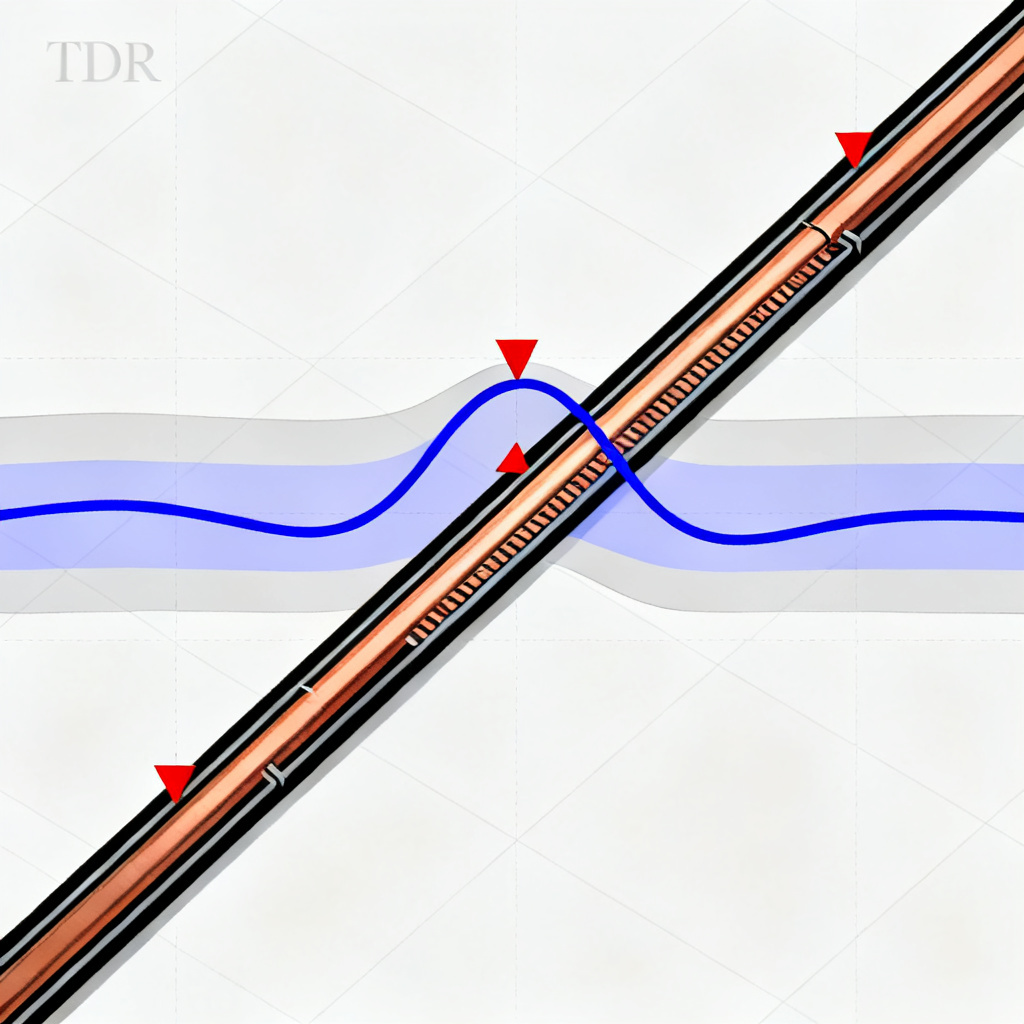
Polar Si9000 can simulate TDR impedance profiles by combining impedance tolerance with transmission line length. This is crucial for predicting where reflections occur along long traces. Use Si9000 to generate an impedance vs. position profile based on manufacturing tolerance variations.
Practical Implications for B2B PCB Manufacturing
Setting Realistic Impedance Tolerance Specifications
| Application | Target Tolerance | Typical Γ (max) | VSWR (max) |
|---|---|---|---|
| DDR4/DDR5 | ±10% | 0.0526 | 1.11 |
| PCIe Gen 4/5 | ±7% | 0.0377 | 1.08 |
| 10G+ Ethernet | ±5% | 0.0256 | 1.05 |
| RF/Microwave | ±3% | 0.0152 | 1.03 |
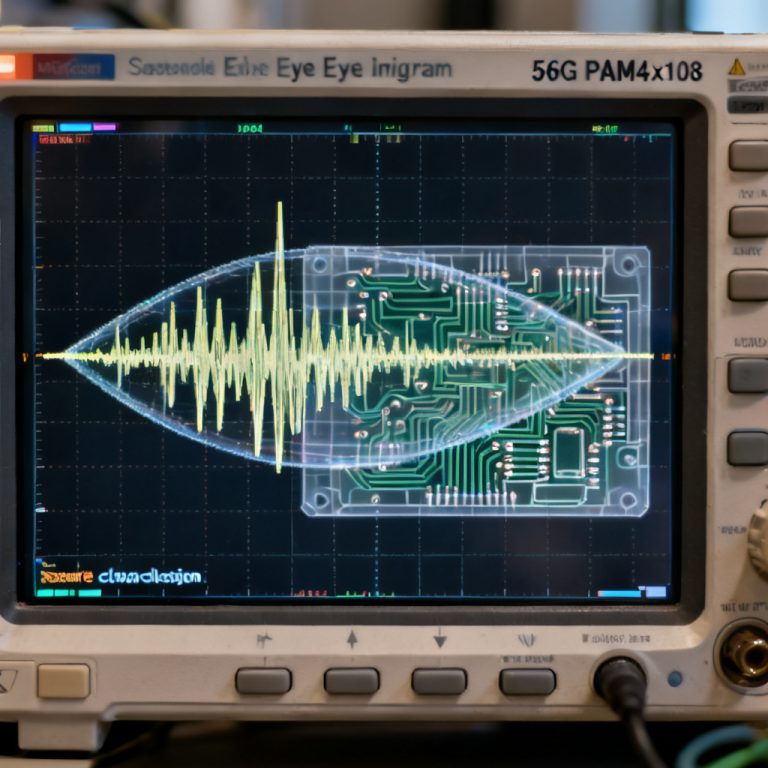
Use Polar Si9000 to validate that your chosen tolerance yields acceptable reflection for your signal rise time. For a 100ps rise time, a 1-inch section of 50Ω ±10% line creates a reflection of 5% of the signal amplitude.
How Polar Si9000 Helps Manufacturers Guarantee Impedance

For B2B PCB suppliers, Polar Si9000 enables pre-production modeling, coupon design, and statistical process control (SPC). In a real-world case, a 12-layer board with 50Ω striplines had a target tolerance of ±10%. Si9000 predicted a 3σ impedance range of 48.5Ω to 51.5Ω. Actual TDR measurements showed 48.2Ω to 51.8Ω, with a reflection coefficient of 0.018 (1.8%).
Optimizing Stack-Up and Material Selection to Minimize Reflection
Material Dk Tolerance Impact
Dielectric constant (Dk) variation is the largest contributor to impedance tolerance. Standard FR-4 has a Dk tolerance of ±5%, leading to Z₀ variation of ±4%. High-speed laminates like Megtron 6 have a Dk tolerance of ±2%, resulting in Z₀ variation of ±1.5%.
Etching and Copper Thickness Compensation
Etching undercuts reduce trace width, increasing impedance. Polar Si9000’s “Etch Factor” feature models this effect. For 1oz copper, Z₀ may shift by 2-3Ω, increasing reflection by 2-3%. Mitigation includes adjusting target Z₀ or specifying tighter etch tolerance.
Frequently Asked Questions
How does Polar Si9000 help predict reflection in transmission line from impedance tolerance?
Polar Si9000 uses field solving and Monte Carlo analysis to model impedance variations due to manufacturing tolerances, directly calculating the reflection coefficient and VSWR from the predicted impedance distribution.
What is the relationship between impedance tolerance and signal reflection?
Impedance tolerance directly determines the magnitude of signal reflection. A wider tolerance (e.g., ±10%) results in a higher reflection coefficient (up to 5.26% for 50Ω lines), while tighter tolerance (±3%) reduces reflection to approximately 1.5%.
How can I use Polar Si9000 to set realistic impedance tolerance specifications?
By performing tolerance sensitivity analysis in Si9000, you can correlate manufacturing variability with reflection performance, enabling data-driven specification of impedance tolerance for applications like DDR4, PCIe, or 10G Ethernet.
Conclusion: Integrating Polar Si9000 into Your Design-for-Manufacturing Workflow
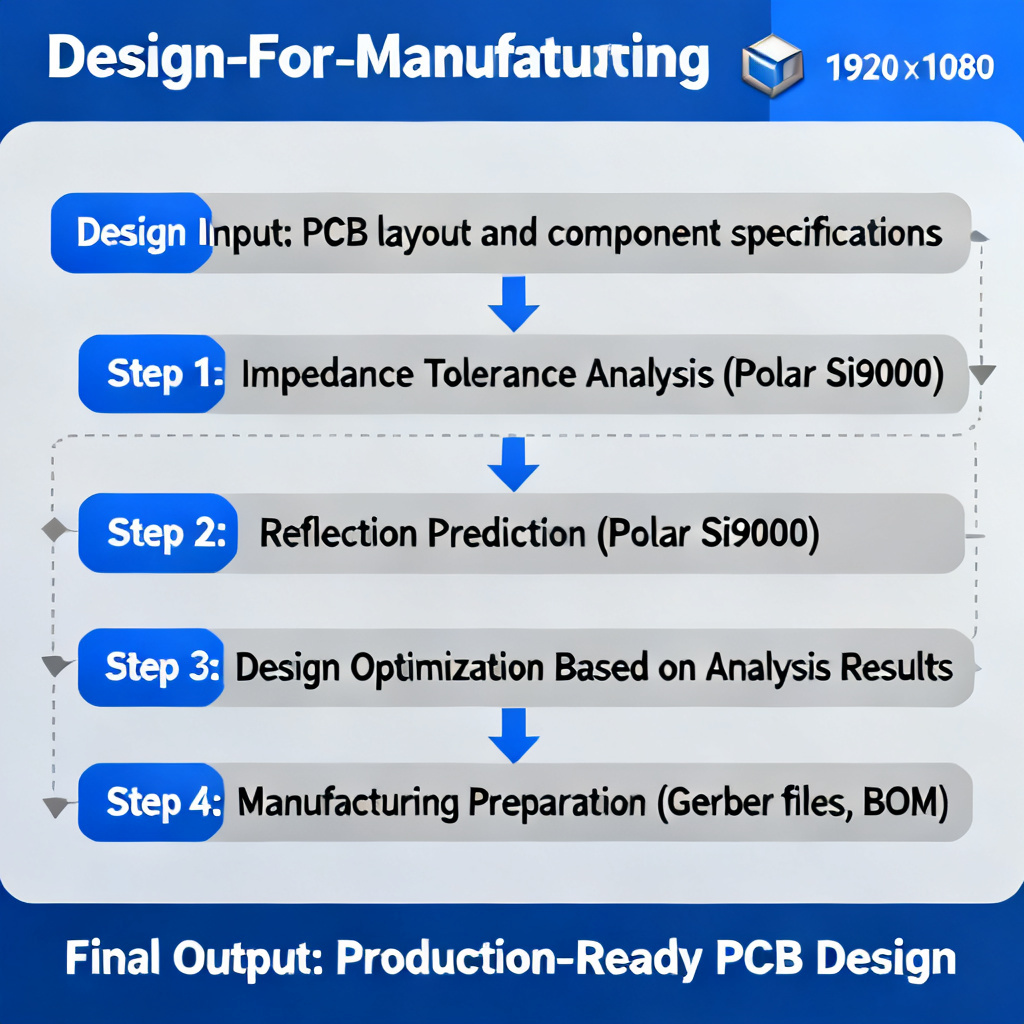
To minimize reflection in transmission line from impedance tolerance, use Polar Si9000 for tolerance analysis, set reflection coefficient targets based on signal amplitude, validate with TDR simulation, and communicate results with your PCB manufacturer. This approach ensures robust high-speed PCB performance in production.
Additional Resources for Engineers
- Polar Instruments Si9000 User Guide – Section on “Monte Carlo and Sensitivity Analysis”
- IPC-2141A – Controlled Impedance Circuit Boards
- High-Speed Digital Design: A Handbook of Black Magic – Chapter on “Transmission Line Reflections”