In high-speed PCB design, understanding the Eye Diagram PCB Statistical vs Bathtub Eye decision is critical for signal integrity. This guide compares both methods to help you choose the right approach for your high-speed PCB projects.
What Is an Eye Diagram in High-Speed PCB Design?
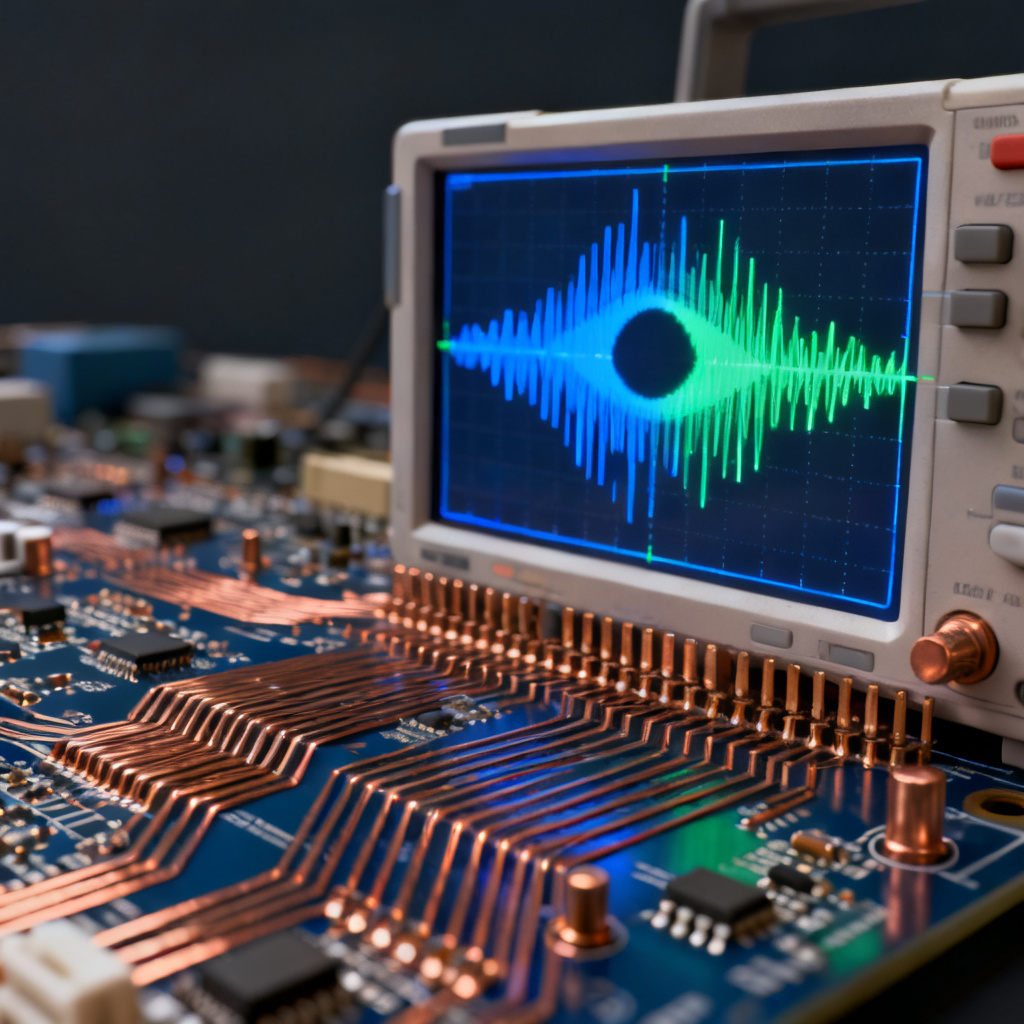
An eye diagram PCB is a visualization of a digital signal’s electrical behavior over time, created by overlaying multiple transitions. The resulting pattern resembles an open eye, where the eye opening (height and width) indicates signal quality.
- Eye Height: The voltage margin between logic levels. A larger eye height means better immunity to noise.
- Eye Width: The time margin for sampling the signal. A wider eye width reduces timing jitter.
- Jitter: The deviation from ideal timing, visible as “closing” of the eye.
In high-speed PCB design, eye diagrams evaluate transmission lines, connectors, vias, and other channel components, helping identify issues like reflections, crosstalk, and impedance mismatches.
Statistical Eye Diagram: The Probabilistic Approach for High-Speed PCB
Definition and Methodology
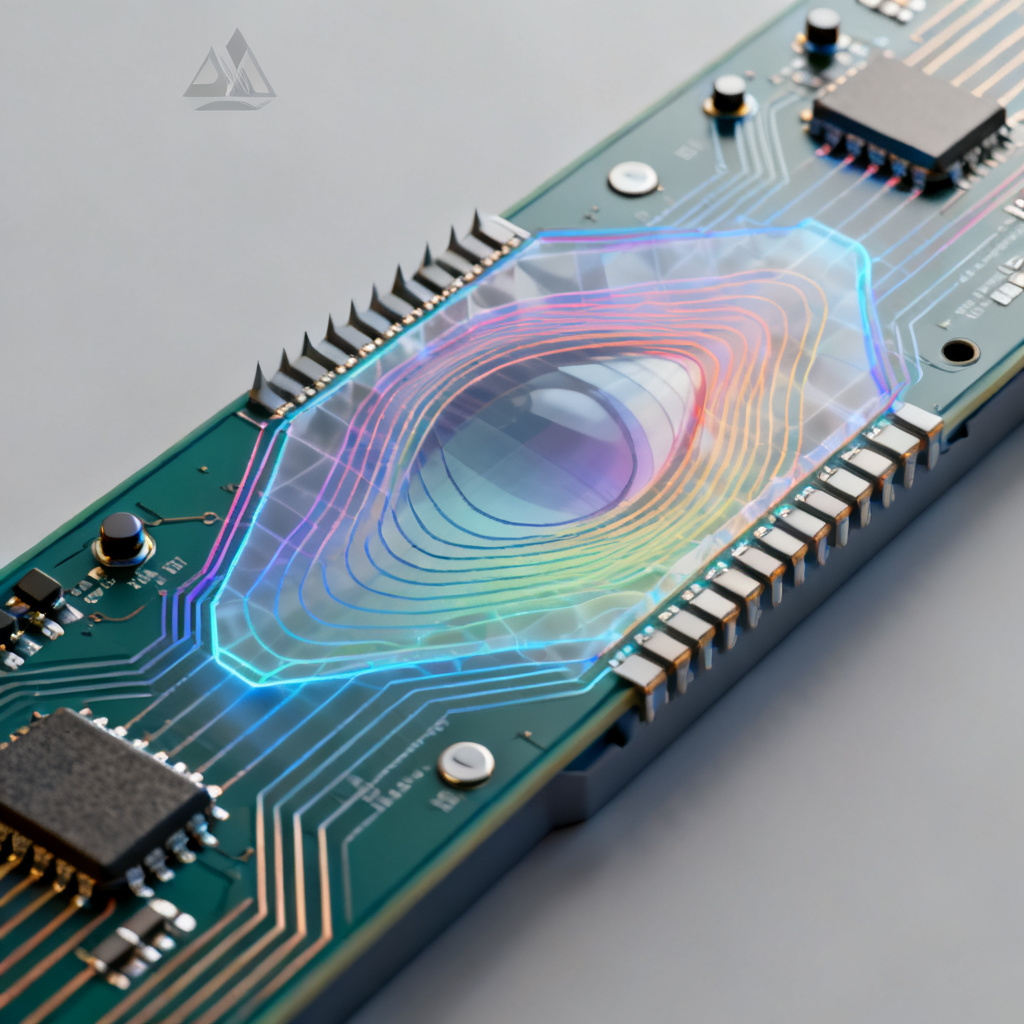
A statistical eye diagram is a mathematical model predicting the eye shape based on probability density functions (PDFs) for voltage noise and timing jitter. Unlike conventional methods, it convolves these PDFs to generate eye contours at different BER levels (e.g., 1e-12, 1e-15).
Key Characteristics
- Fast Simulation: Statistical analysis computes BER for billions of bits in seconds, ideal for pre-layout design exploration.
- BER Contours: Output includes eye openings at specific BER thresholds, reflecting rare high-jitter events.
- Noise and Jitter Separation: Clearly distinguishes random jitter (RJ, Gaussian) from deterministic jitter (DJ, bounded).
- Predictive Power: Predicts performance under worst-case conditions without simulating every scenario.
Advantages in High-Speed PCB Design
- Early Stage Analysis: Use during pre-layout to set design constraints (e.g., trace length matching, impedance tolerance).
- Channel Optimization: Quickly compare topologies (e.g., microstrip vs. stripline, via structures).
- Crosstalk Budgeting: Model statistical effect of aggressor lines on a victim channel.
Limitations
- Assumes Stationarity: Assumes noise and jitter statistics don’t change over time, which may not hold in real systems.
- Ignores Nonlinearities: Cannot accurately model non-linear effects like clock recovery circuits or equalization dynamics.
Bathtub Eye: The Time-Domain BER Curve for High-Speed PCB
Definition and Methodology
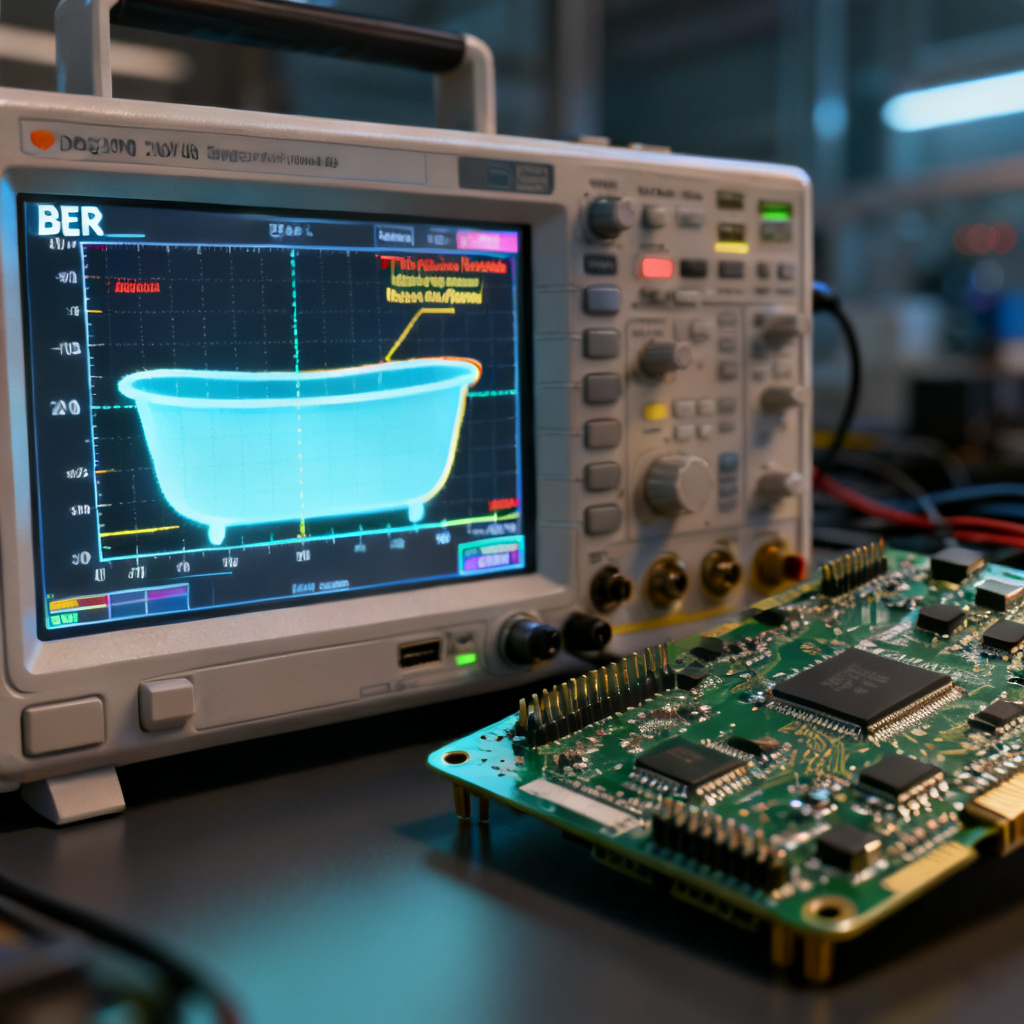
A bathtub eye is a plot of BER as a function of sampling phase within one unit interval (UI). Derived from time-domain simulations or measurements, the curve often has a flat bottom (low BER in center) and steep sides (high BER near edges).
Key Characteristics
- BER vs. Time: X-axis is sampling phase (0 to 1 UI); Y-axis is BER (log scale). The flat region width at a given BER defines the eye opening.
- Jitter Decomposition: Curve slopes reveal jitter types: steep slopes indicate deterministic jitter; gentle slopes indicate random jitter.
- Total Jitter (TJ): Extracted from the bathtub curve at specific BER (e.g., TJ@1e-12 = eye width at that BER).
Advantages in High-Speed PCB Design
- Real-World Validation: Use during post-layout simulation or lab testing to validate actual hardware.
- Equalizer Effects: Accurately captures impact of equalization (e.g., CTLE, DFE) on jitter and BER.
- Timing Margin: Directly provides timing margin (eye width) for the receiver’s clock and data recovery (CDR) circuit.
Limitations
- Computationally Intensive: Requires simulating or measuring trillions of bits to reach low BER levels (e.g., 1e-15), taking hours or days.
- Sensitive to Pattern: Result depends on bit sequence used; a PRBS pattern may not represent worst-case conditions.
Statistical vs. Bathtub Eye: Key Differences for High-Speed PCB
| Aspect | Statistical Eye Diagram | Bathtub Eye (Time-Domain) |
|---|---|---|
| Output | Eye diagram with BER contours | BER vs. phase curve |
| Method | Probabilistic convolution of PDFs | Time-domain bit-by-bit simulation or measurement |
| Speed | Very fast (seconds) | Slow (hours for low BER) |
| Jitter Decomposition | Yes, separate RJ and DJ | Yes, from curve slopes |
| Equalization Modeling | Limited (linear only) | Accurate (including non-linear) |
| Use Case | Pre-layout design exploration | Post-layout validation |
| BER Range | Can predict to 1e-15+ | Limited by simulation length |
Which One to Use: A Practical Guide for High-Speed PCB
When to Use Statistical Eye Diagram
- Early Design Stage: Quickly evaluate multiple design options (e.g., layer stack, trace width, via count).
- Channel Sensitivity Analysis: Understand how jitter and noise budgets affect BER.
- Crosstalk and ISI: Model statistical effect of inter-symbol interference (ISI) and crosstalk from multiple aggressors.
- High-Speed Serial Links: For standards like PCIe Gen5/6, USB4, or 100GbE with stringent BER requirements.
When to Use Bathtub Eye
- Post-Layout Verification: After PCB is designed, run time-domain simulation to confirm eye opening meets target BER.
- Equalizer Tuning: Bathtub curves accurately show how CTLE or DFE improves timing margin.
- Lab Measurement: Derive bathtub curve from real oscilloscope captures (using BERT or sampling scope) for final validation.
- Non-Ideal Channels: For channels with nonlinearities (e.g., clock recovery, decision feedback equalization).
Hybrid Approach
In practice, most high-speed PCB engineers use both methods in a complementary workflow:
- Pre-layout: Use statistical eye diagrams to set design rules (e.g., max trace length, impedance tolerance).
- Post-layout: Run time-domain simulation to generate a bathtub curve. Compare eye width at target BER (e.g., 1e-12) with statistical prediction.
- Lab: Measure actual bathtub curve on prototype boards. Match with simulation for validation.
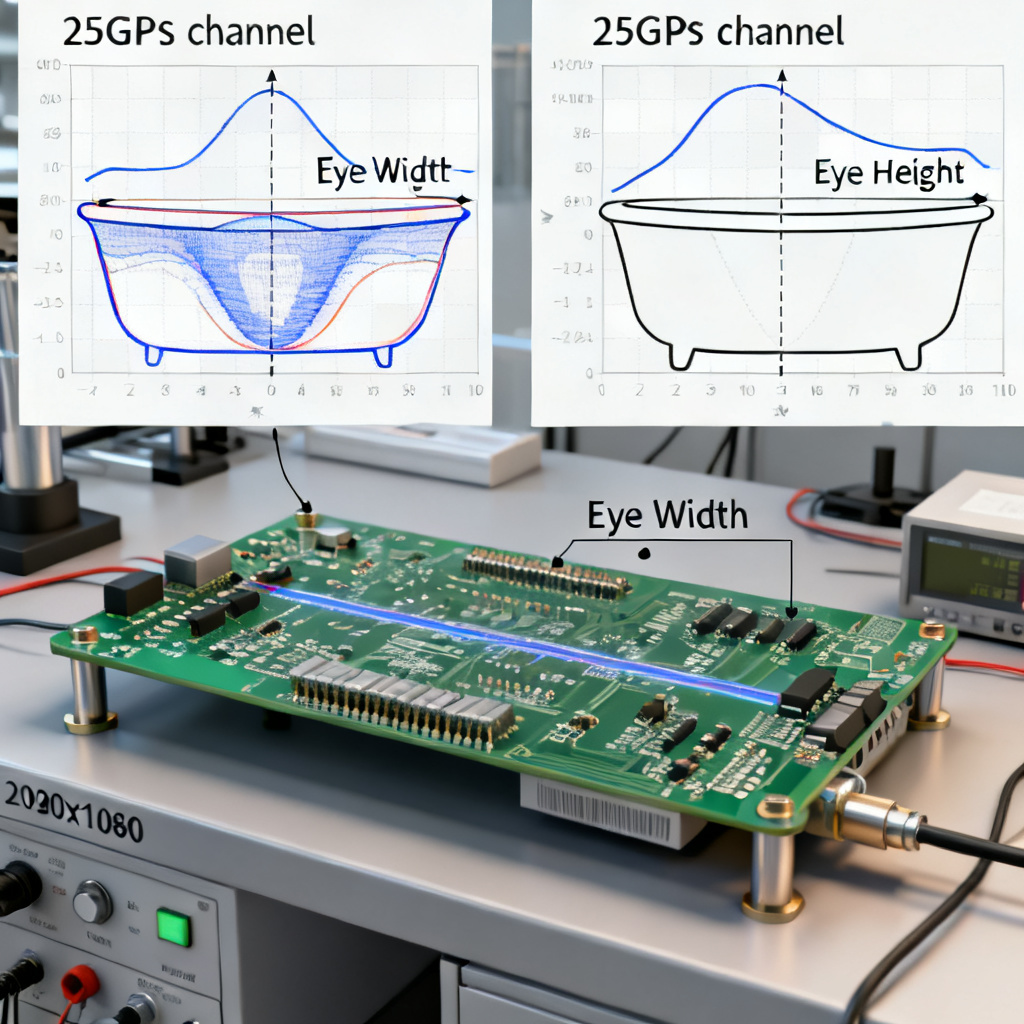
Practical Example: 25 Gbps High-Speed PCB Channel
Consider a 25 Gbps backplane channel with a 30-inch trace, two connectors, and four vias.
- Statistical Analysis: In 30 seconds, simulate statistical eye showing at BER=1e-12, eye height = 150 mV and eye width = 0.4 UI. Identify via stub as main jitter contributor (deterministic jitter).
- Time-Domain Simulation: Run 10^12-bit PRBS31 pattern. After 4 hours, bathtub curve shows eye width = 0.38 UI at BER=1e-12. The 0.02 UI difference is due to non-linear effects from connector’s impedance discontinuity.
- Decision: The 0.38 UI margin is acceptable for receiver (requires >0.3 UI). Proceed to prototype.
FAQ: Eye Diagram PCB Statistical vs Bathtub Eye
What is the main difference between statistical eye diagram and bathtub eye in high-speed PCB?
The statistical eye diagram uses probability-based modeling for fast pre-layout analysis, while the bathtub eye provides accurate time-domain BER curves for post-layout validation in high-speed PCB design.
Which method is better for high-speed PCB signal integrity analysis?
Both are complementary: statistical eye diagram is better for early design exploration, and bathtub eye is better for final validation of high-speed PCB channels.
How does jitter affect eye diagram PCB statistical vs bathtub eye results?
In statistical eye diagrams, jitter is separated into RJ and DJ using PDFs. In bathtub eyes, jitter types are revealed by curve slopes, providing direct timing margin for high-speed PCB designs.
Can I use only statistical eye diagram for high-speed PCB design?
No, for high-speed PCB production, you need both: statistical for initial design and bathtub for final validation to ensure real-world performance.
Conclusion: Eye Diagram PCB Statistical vs Bathtub Eye in High-Speed PCB Design
The choice between Eye Diagram PCB Statistical vs Bathtub Eye depends on your design phase. Statistical is your tool for rapid, predictive analysis in early stages. Bathtub is your tool for accurate, real-world validation in later stages. For high-speed PCB design, mastering both techniques ensures your PCB meets stringent BER requirements of modern serial links, from PCIe to Ethernet to SerDes.