Mastering how to use an oscilloscope to capture reflection in transmission line waveforms is essential for high-speed PCB signal integrity. This guide provides step-by-step TDR techniques for accurate impedance measurement and fault detection.
1. Understanding Transmission Line Reflection Fundamentals
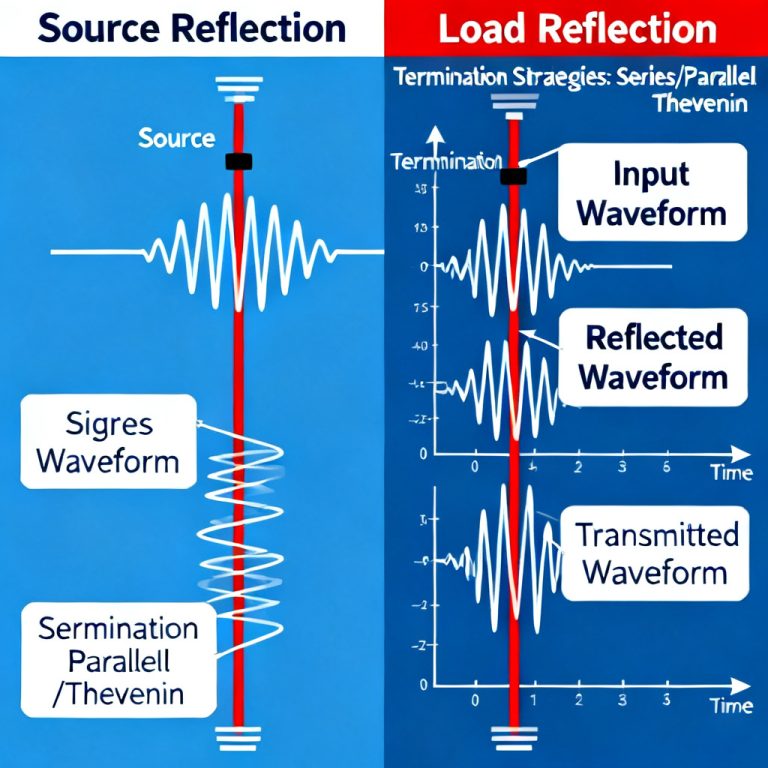
Reflection in transmission line waveforms occurs when a signal encounters an impedance mismatch. The reflection coefficient (Γ) determines the magnitude and polarity of the reflected wave, directly impacting high-speed PCB performance.
1.1 The Reflection Coefficient (Γ)
The reflection coefficient is defined as Γ = (Z_L – Z_0) / (Z_L + Z_0), where Z_0 is the characteristic impedance and Z_L is the load impedance. An open circuit (Z_L = ∞) yields Γ = +1, while a short circuit (Z_L = 0) yields Γ = -1. A matched load (Z_L = Z_0) produces no reflection, which is the goal for transmission line design.
1.2 Time Domain Reflectometry (TDR) Principle
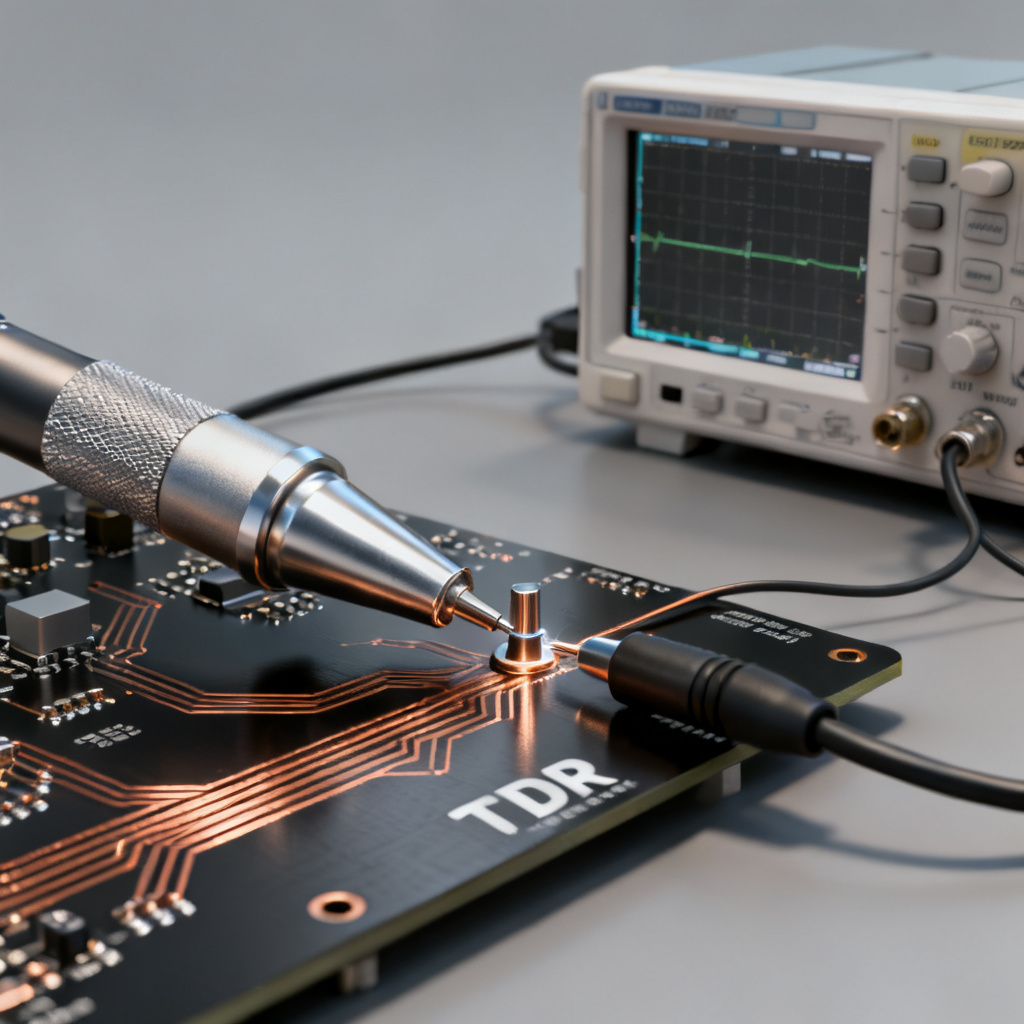
TDR uses a fast step generator to launch a signal down the transmission line. The oscilloscope monitors the voltage at the launch point and measures the time delay of any reflected signal. This time delay corresponds to twice the distance to the discontinuity, enabling precise location of faults in high-speed PCB traces.
2. Essential Equipment and Setup for Reflection Capture
To capture reflection in transmission line waveforms accurately, you need the right oscilloscope, probes, and cabling. Proper setup minimizes measurement errors and ensures reliable TDR results for high-speed PCB validation.
2.1 Choosing the Right Oscilloscope
For reflection measurements, an oscilloscope with at least 1 GHz bandwidth is recommended, with 4 GHz or more for high-resolution analysis. The rise time of the step generator and oscilloscope bandwidth are directly related: bandwidth (GHz) ≈ 0.35 / rise time (ns). A high sampling rate (e.g., 40 GS/s) captures fast reflections with fine time resolution. Some oscilloscopes have built-in TDR hardware and software, while others require an external TDR module or fast pulse generator.
2.2 Selecting the Correct Probe
The probe is critical for accurate reflection measurements. For TDR, a 50Ω passive probe is standard, providing matched impedance to the 50Ω system. Active probes with high impedance (1 MΩ, 1 pF) are suitable for low-frequency measurements but have limited bandwidth. The best method is direct SMA-to-BNC connection to the oscilloscope’s 50Ω input, eliminating probe loading. Specialized TDR probes (e.g., Tektronix P6150 or Keysight N2873A) have very low input capacitance (0.3 pF) and high bandwidth (10 GHz). For differential pairs, use high-bandwidth differential active probes (e.g., Tektronix P7380SMA or Keysight N2750A series) to capture common-mode reflections and differential impedance mismatches.
2.3 Test Fixture and Cabling
Use high-quality, low-loss coaxial cables with SMA connectors. Keep cable lengths short to reduce signal degradation and delay. Perform a “through” calibration (or open/short/load calibration) to remove cable and fixture effects. Before measuring the DUT, verify your setup by measuring a known 50Ω load—a perfect 50Ω load should show no reflection.
3. Step-by-Step Procedure to Capture Reflections
Follow these steps to set up your oscilloscope and capture reflection in transmission line waveforms effectively. Each step is designed to maximize accuracy for high-speed PCB troubleshooting.
Step 1: Configure the Oscilloscope
Set the oscilloscope’s input impedance to 50Ω (mandatory for TDR). Select a time base that shows both the incident step and the reflected signal (e.g., 2 ns/div for a 10 cm trace). Set the vertical scale to clearly display the step amplitude (e.g., 200 mV/div for a 1V step). Use a rising edge trigger on the same channel, set to about 50% of the step amplitude. Enable infinite persistence to observe random reflections from intermittent connections or noise.
Step 2: Connect the Pulse Generator
If using an external pulse generator, connect its output to the oscilloscope’s input via a T-connector or power divider. The third port connects to the DUT. Ensure the pulse generator’s output impedance is 50Ω and amplitude is within the oscilloscope’s input range (typically < 5V). For built-in TDR oscilloscopes, connect the TDR port directly to the DUT via a high-quality cable.
Step 3: Probe the DUT
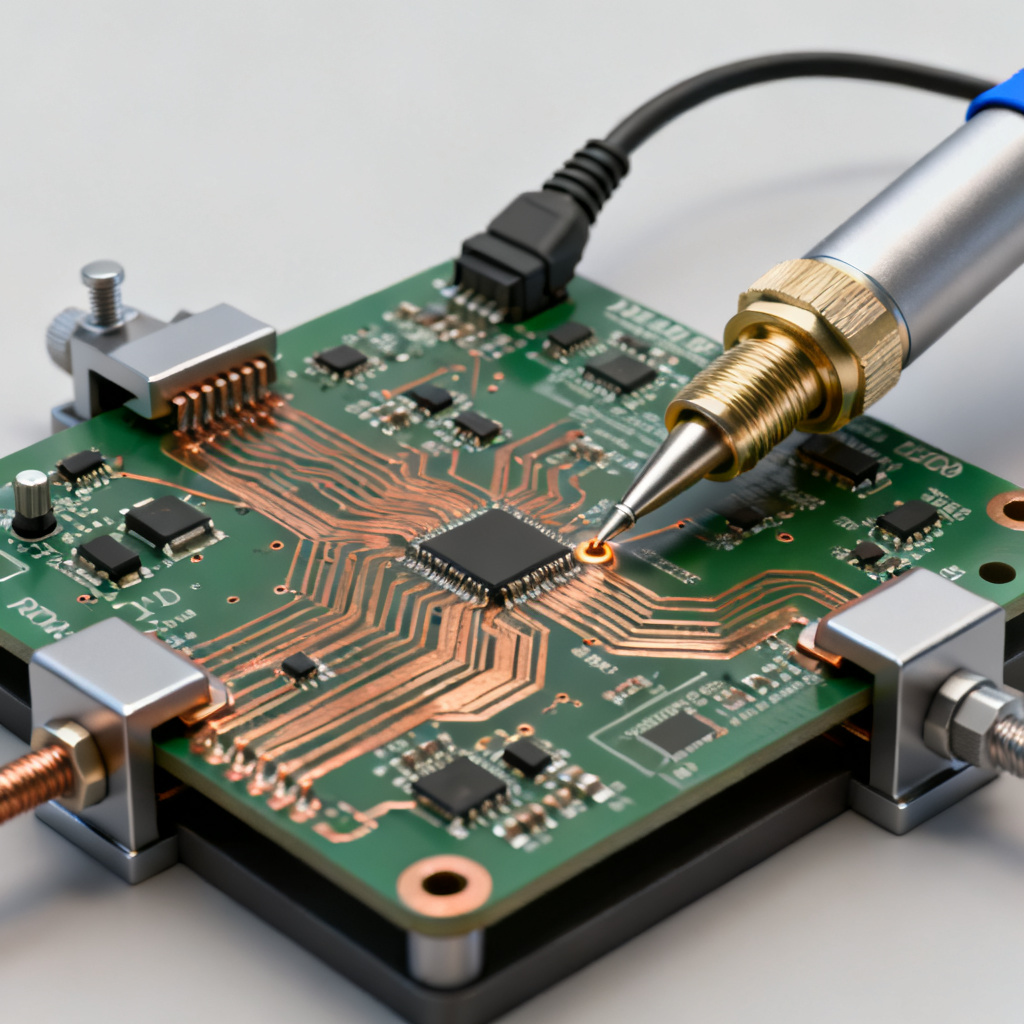
For SMA connectors, use a direct SMA-to-SMA cable or SMA-to-BNC adapter with a 50Ω cable. For surface-mount pads, use a TDR probe with a micro-coaxial tip or solder-in adapter. For vias or test points, use a hand-held TDR probe with a fine pitch tip. Maintain good contact and minimize probe movement to avoid measurement artifacts.
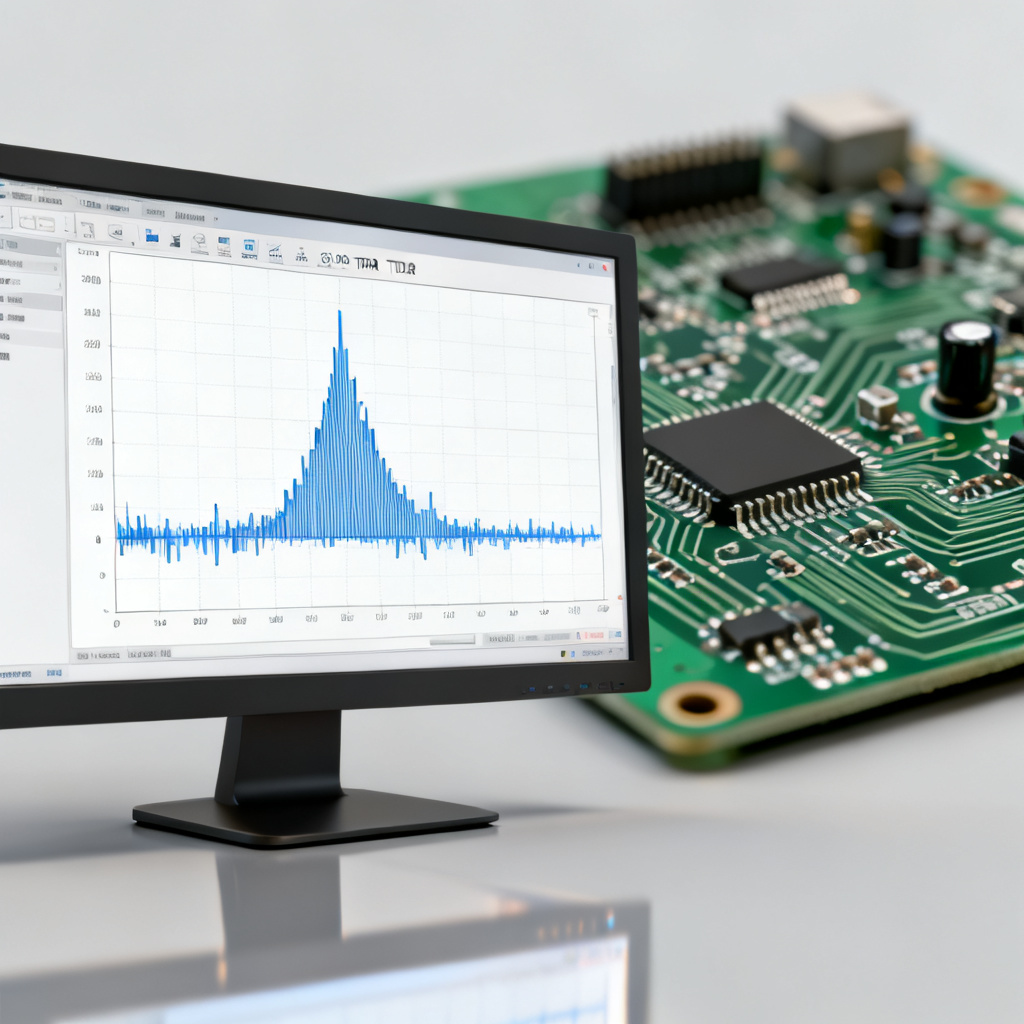
Step 4: Capture the Waveform
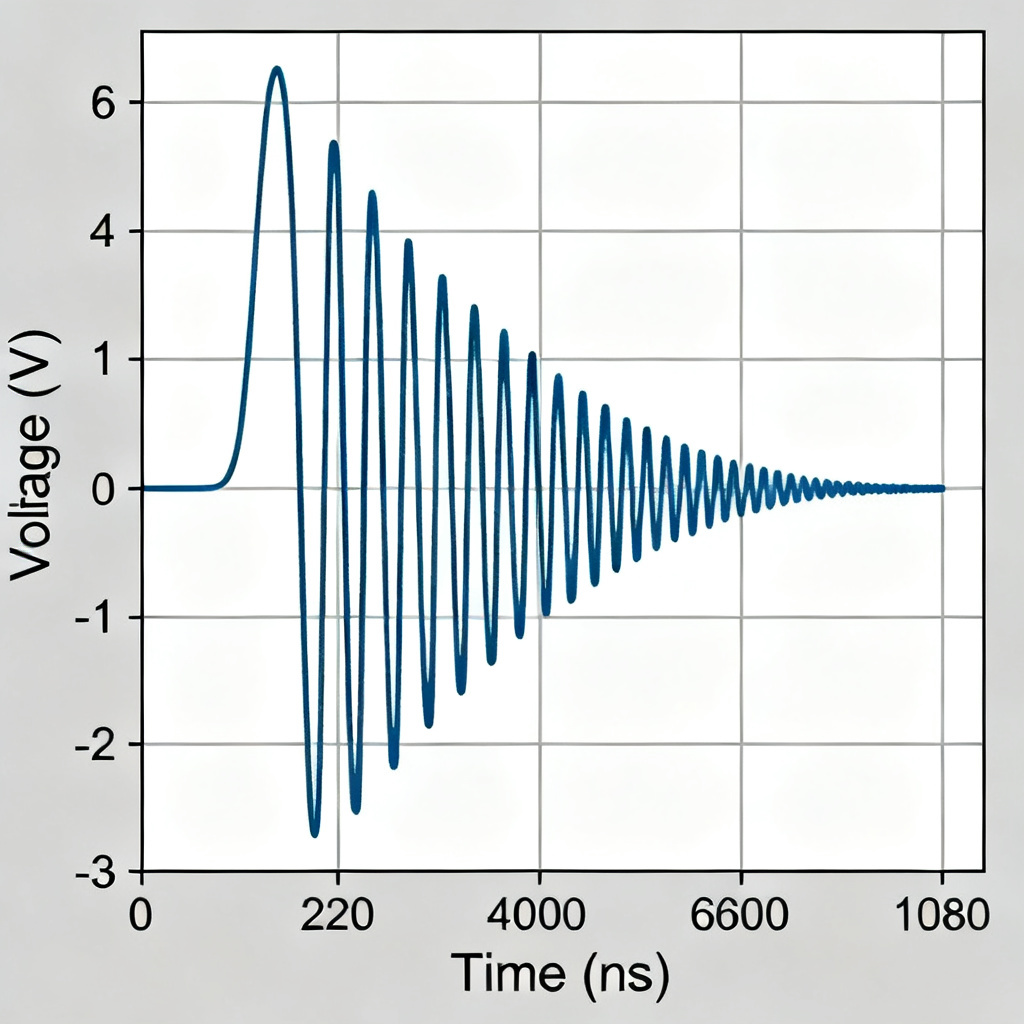
Observe the clean, fast-rising incident step. Identify the reflected signal as a second edge or change in the waveform. Zoom in on the reflection and use cursors to measure the time delay (Δt) and amplitude (V_reflected). Calculate the impedance using the reflection coefficient formula: V_reflected = Γ × V_incident, and Z_load = Z_0 × (1 + Γ) / (1 – Γ).
Step 5: Analyze the Reflection Shape
The shape of the reflection reveals the nature of the discontinuity: a positive reflection indicates higher impedance (open circuit, narrow trace, series inductor); a negative reflection indicates lower impedance (short circuit, wide trace, shunt capacitor). An inductive discontinuity shows a positive spike followed by gradual return to baseline, while a capacitive discontinuity shows a negative dip with gradual return. A resistive discontinuity appears as a step change in the baseline level.
4. Advanced Techniques and Troubleshooting
Advanced methods like differential TDR and impedance profiling enhance your ability to capture reflection in transmission line waveforms for complex high-speed PCB designs.
4.1 Differential TDR (DTDR)
For differential pairs, use a differential TDR source (or single-ended source with a balun) and a differential probe. DTDR reveals both differential impedance (Z_diff) and common-mode impedance (Z_cm). A mismatch in Z_diff can cause common-mode noise and EMI, critical for high-speed interfaces like USB, HDMI, and PCIe.
4.2 Measuring Impedance Profile
Modern oscilloscopes with TDR software automatically convert the time-domain reflection waveform into an impedance profile. This requires calibrating the system with a known impedance standard (e.g., 50Ω) and using the velocity of propagation (Vp) to convert time to distance. The resulting plot shows impedance (Z) on the y-axis and distance on the x-axis, providing a visual map of impedance variations along the trace.
4.3 Dealing with Multiple Reflections
In complex PCBs, multiple reflections from several discontinuities may overlap. Use a shorter pulse width (e.g., 100 ps) to isolate individual events. Use gating in TDR software to select a specific time window for analysis. Perform a “walk-through” test by moving the probe along the trace and observing how the reflection changes.
4.4 Common Pitfalls and How to Avoid Them
| Pitfall | Cause | Solution |
|---|---|---|
| Ghost Reflections | Impedance mismatch at probe tip or cable | Use a 50Ω probe and ensure tight connections. Calibrate the system. |
| Ringing/Overshoot | Poor probe grounding (long ground lead) | Use a short ground spring or micro-coaxial probe. |
| Noise | High-frequency noise from DUT or environment | Use averaging (multiple acquisitions) or enable bandwidth limiting. |
| Incorrect Impedance Reading | Incorrect velocity of propagation (Vp) | Use the correct εr for your PCB material. Measure Vp using a known-length trace. |
| Probe Loading | Using a high-impedance probe (1MΩ) instead of 50Ω | Always use 50Ω input impedance for TDR. |
5. Interpreting Results for PCB Design and Troubleshooting
Proper interpretation of reflection data is crucial for improving high-speed PCB signal integrity. The following sections guide you through validating impedance, identifying faults, and optimizing designs.
5.1 Validating PCB Impedance
For a 50Ω single-ended trace, the impedance profile should be flat at 50Ω ± 10% (or your design tolerance). For a 100Ω differential pair, the differential impedance profile should be flat at 100Ω. Via impedance often shows lower values (30-40Ω) due to cylindrical shape and capacitance, which is acceptable if the via length is short and the reflection is small.
5.2 Identifying Faults
An open circuit produces a positive reflection (Γ ≈ +1) with a time delay matching the trace length. A short circuit produces a negative reflection (Γ ≈ -1). A cracked trace shows a small positive reflection at the crack location, possibly with intermittent behavior. A cold solder joint appears as a small, erratic reflection at the joint, often visible with persistence.
5.3 Improving Signal Integrity
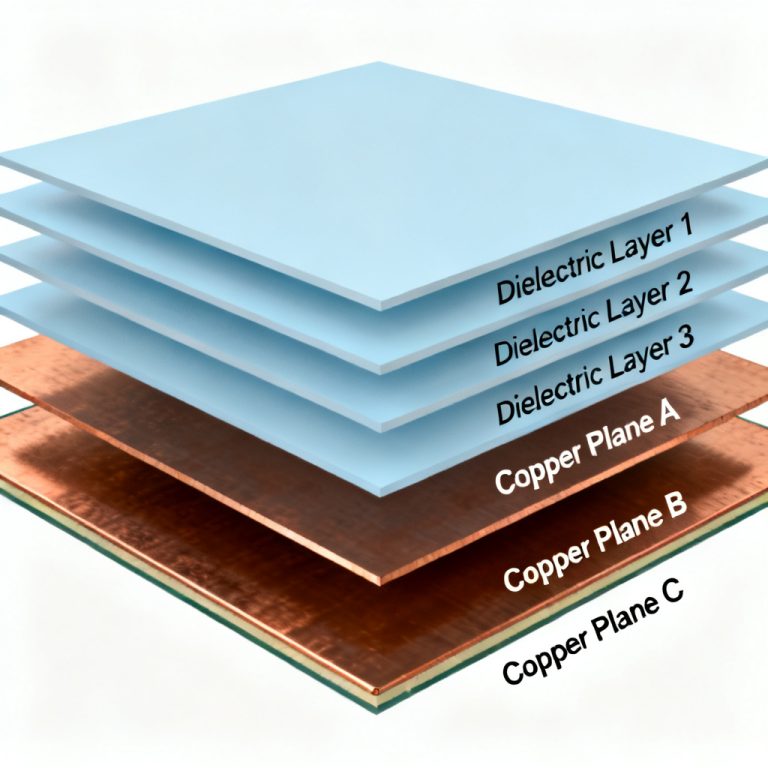
Reduce stub lengths to minimize positive reflections on the impedance profile. Use termination resistors (series or parallel) to match source and load impedance to Z_0. Optimize layer stackup with symmetrical construction and tight coupling between signal and ground layers. Choose low-loss, stable εr materials (e.g., Rogers, Isola) for high-speed designs.
Frequently Asked Questions
What is the best oscilloscope setting to capture reflection in transmission line waveforms?
Set the input impedance to 50Ω, use a time base that shows both the incident step and reflection, and enable persistence. A bandwidth of at least 1 GHz is recommended for accurate reflection in transmission line waveforms.
How do I calculate impedance from a TDR reflection waveform?
Use the reflection coefficient formula: Γ = V_reflected / V_incident, then Z_load = Z_0 × (1 + Γ) / (1 – Γ). This calculation is essential for analyzing reflection in transmission line waveforms.
Why is probe selection critical for capturing reflection in transmission line waveforms?
Probes with incorrect impedance or excessive capacitance can introduce additional reflections, distorting the true reflection in transmission line waveforms. Always use a 50Ω probe or direct coaxial connection for TDR.
Can I use a standard oscilloscope to capture reflection in transmission line waveforms?
Yes, if you have a fast step generator (external or built-in) and a 50Ω input. However, for high-resolution measurements, an oscilloscope with built-in TDR capabilities and bandwidth above 4 GHz is recommended.
What does a positive reflection indicate in transmission line waveforms?
A positive reflection indicates a higher impedance than the characteristic impedance, such as an open circuit, narrow trace, or series inductor. This is a key finding when analyzing reflection in transmission line waveforms.
Conclusion: Mastering Reflection Capture for High-Speed PCB Success
Capturing reflection in transmission line waveforms with an oscilloscope is a fundamental skill for designing and manufacturing reliable high-speed PCBs. By understanding TDR principles, choosing the right equipment, following a systematic setup, and interpreting waveform shapes, you can pinpoint impedance mismatches, validate designs, and ensure first-pass success. At [Your Company Name], we specialize in high-speed PCB manufacturing with tight impedance control and advanced TDR testing. Contact our engineering team for assistance with reflection analysis or high-speed PCB design.