Understanding how to reflection measurement in transmission line using TDR (Time Domain Reflectometry) is essential for any high-speed PCB engineer. This guide provides a complete, step-by-step procedure for performing TDR measurements on PCB transmission lines, covering theory, equipment setup, measurement procedures, and interpretation of results.
Fundamentals of TDR for Reflection Measurement in Transmission Line
How TDR Works for Transmission Line Reflection Measurement
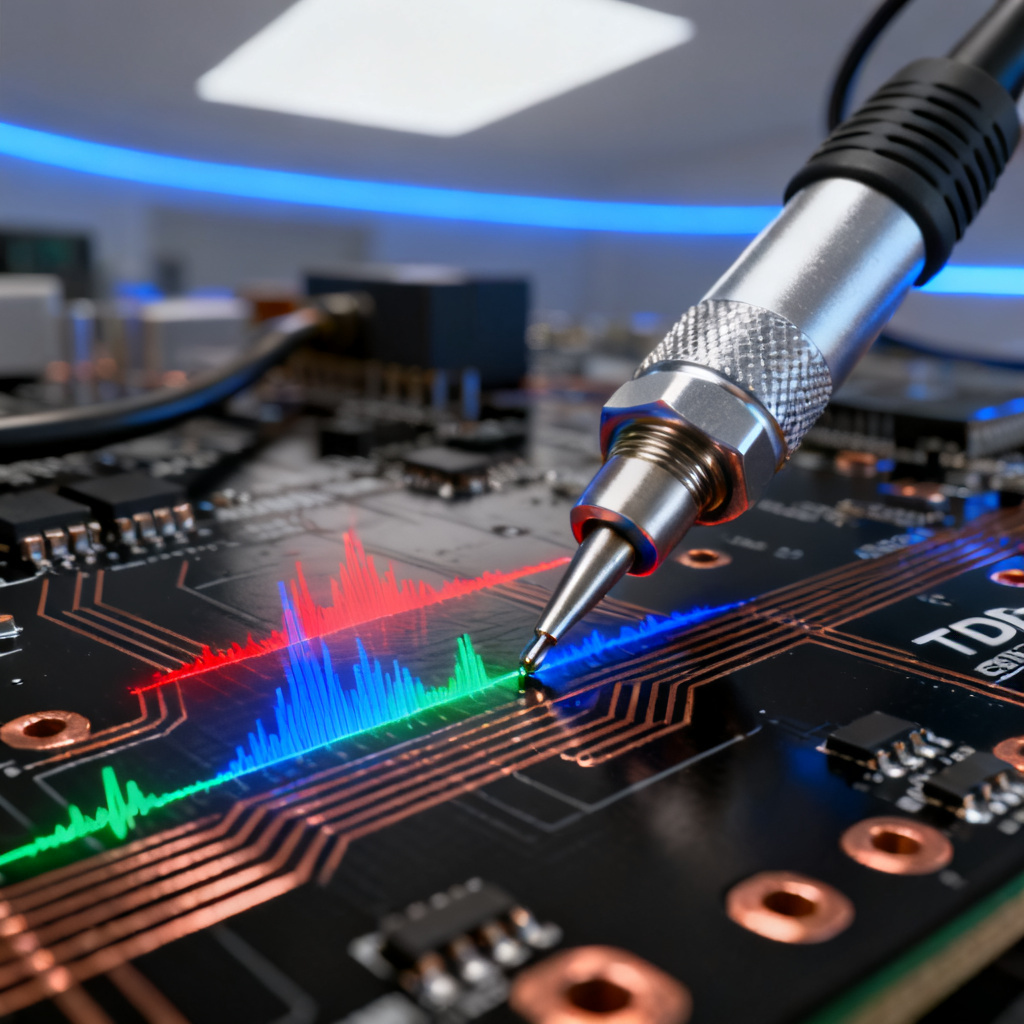
TDR operates on the same principle as radar. A fast-rise-time step pulse (typically 35–100 ps for high-resolution PCB analysis) is launched into the transmission line under test. When the pulse encounters a change in characteristic impedance (Z₀), a portion of the incident energy is reflected back to the TDR source. The instrument measures the amplitude and arrival time of the reflected signal.
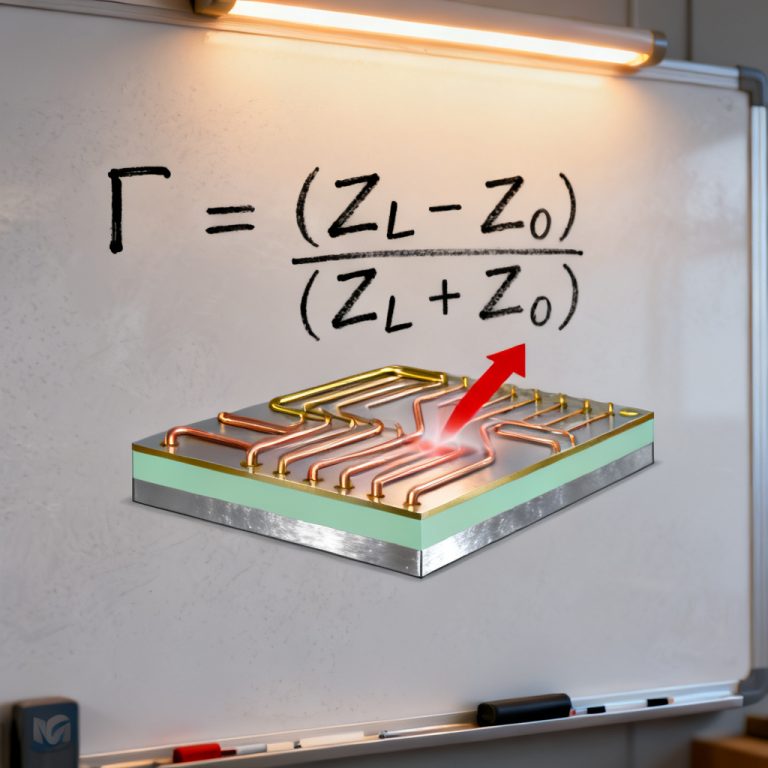
Key equation: ρ = (Z_DUT – Z₀) / (Z_DUT + Z₀). A positive ρ indicates a higher impedance (e.g., open circuit → ρ = +1), while a negative ρ indicates a lower impedance (e.g., short circuit → ρ = -1).
Relationship Between Time and Distance for TDR Reflection Measurement
The TDR instrument measures the round-trip time of the pulse. To convert time to physical distance along the PCB trace: d = (v * t) / 2. For FR-4 PCB material, the effective dielectric constant (εr) is about 4.0–4.5. The velocity factor is 1/√εr. When using a TDR with a 50 Ω reference, always calibrate the velocity factor based on your specific PCB stackup.
Essential TDR Equipment for Measuring Reflection in Transmission Line
Types of TDR Instruments for Transmission Line Reflection Measurement
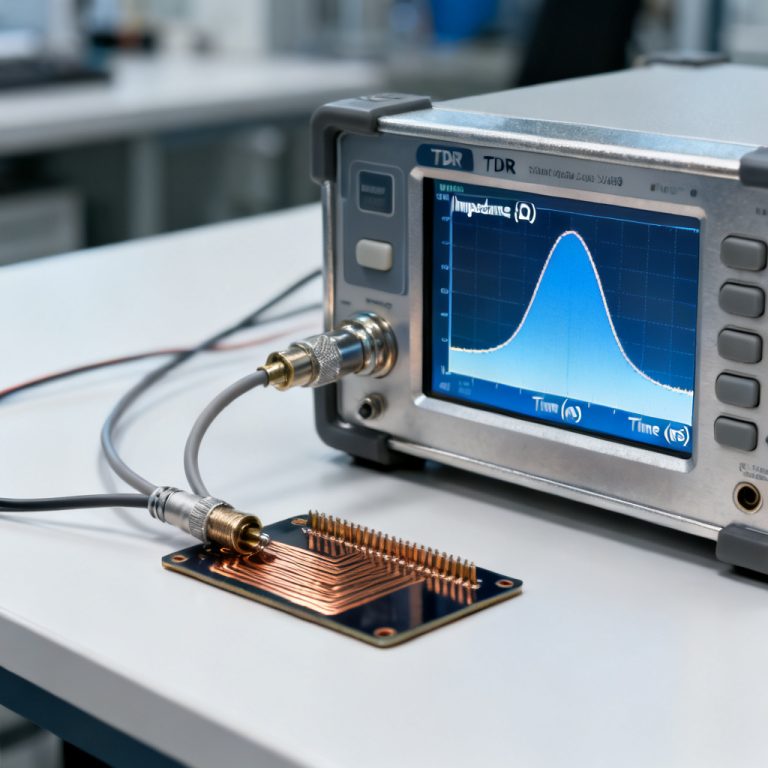
Three main categories exist: Dedicated TDR (e.g., Tektronix 80E04) with 35 ps rise time and <1 mm resolution; Sampling Oscilloscope with TDR module (40–100 ps rise time, 1–3 mm resolution); Vector Network Analyzer (VNA) with TDR transform. For PCB engineers, a sampling oscilloscope with a TDR module (e.g., Keysight DCA-X or Tektronix DSA8300) offers the best balance for production-level testing.
Required Cables and Probes for TDR Reflection Measurement
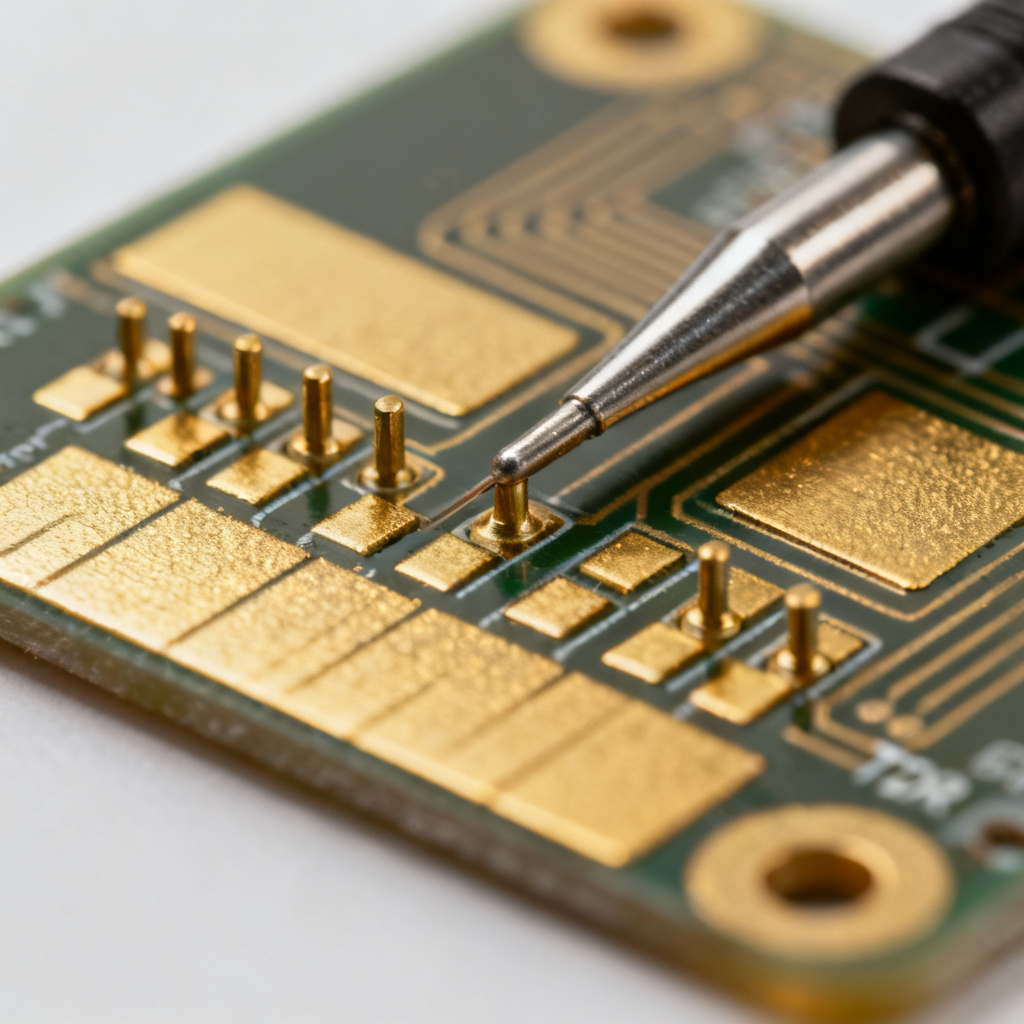
Use low-loss 50 Ω coaxial cables (e.g., Gore or Semflex) – keep total cable length <2 m. Use SMA-to-microstrip adapters for connecting to PCB traces. Use GS (Ground-Signal) probes for non-contact or semi-contact measurements on fine-pitch traces. A calibration kit including open, short, and 50 Ω load standards is essential.
Calibration Procedure for Accurate TDR Reflection Measurement
Step 1: Self-Calibration – Connect the TDR module to a known 50 Ω reference load. Step 2: Open/Short/Load Calibration – Perform a full 3-standard calibration at the measurement plane (the probe tip): Open (maximum positive pulse), Short (maximum negative pulse), 50 Ω Load (flat line with zero reflection). This removes systematic errors from cables and adapters.
Step-by-Step Procedure to Measure Reflection in Transmission Line Using TDR
Preparing the PCB for TDR Reflection Measurement
Select a test coupon or dedicated test trace of known length (e.g., 10 cm) with the same stackup as the actual design. Clean the pads using isopropyl alcohol. For impedance measurement, leave the far end open (to see the full reflection), or terminate with a 50 Ω load to simulate normal operation.
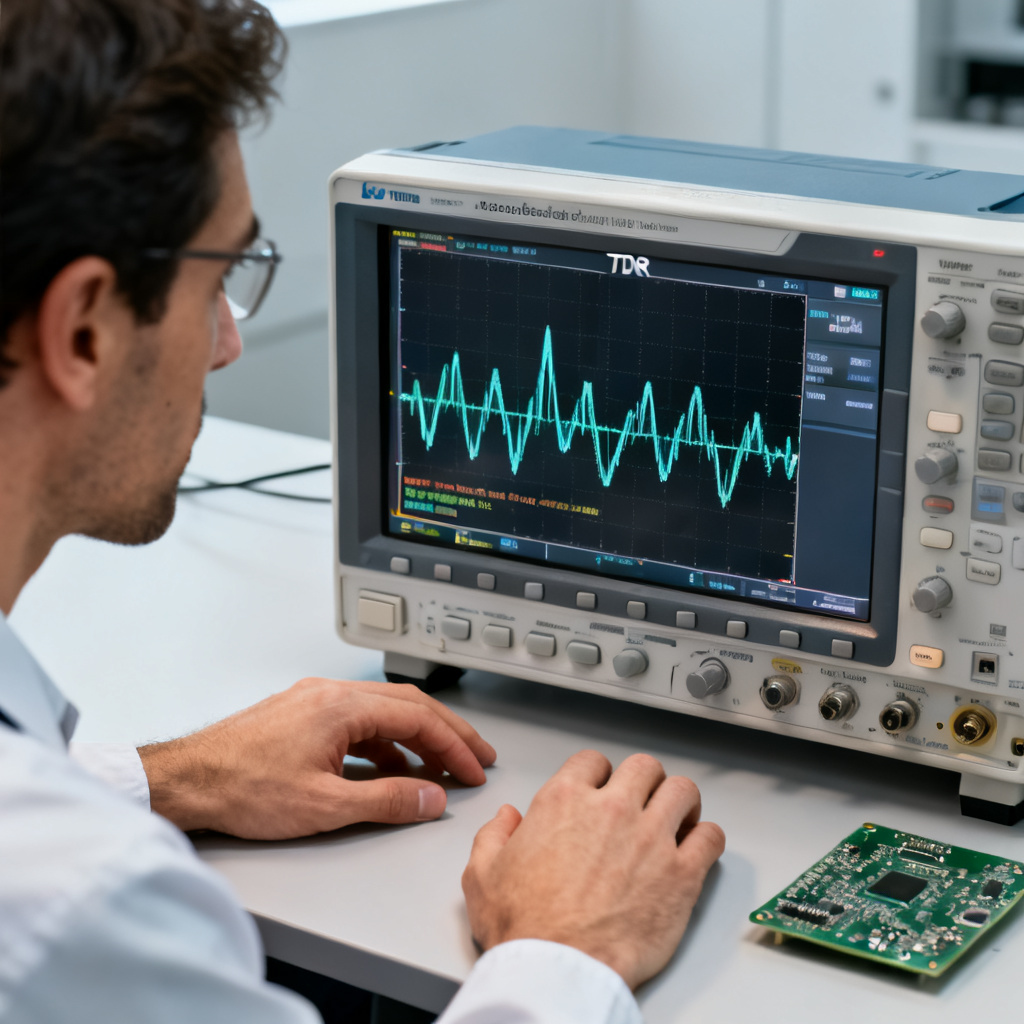
Measurement Procedure for Transmission Line Reflection Using TDR
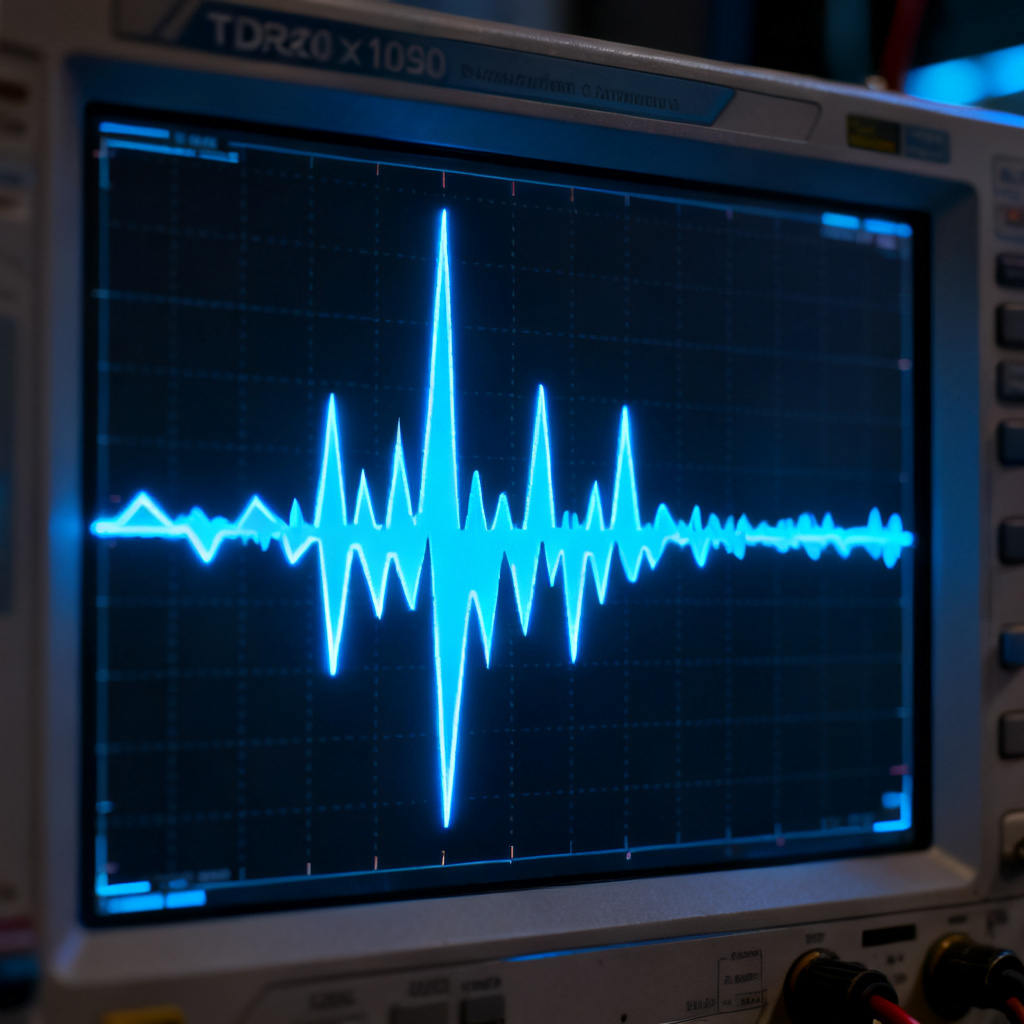
Step 1: Connect the TDR – Attach the SMA cable to the PCB using a high-quality adapter. Step 2: Set Up the Instrument – Set rise time to 35–50 ps, time base to 2 ns/div for a 10 cm trace on FR-4, enable 16- or 64-point averaging. Step 3: Capture the Waveform – Observe the displayed waveform. Step 4: Identify Discontinuities – Look for any deviation from the flat line. Common discontinuities include capacitive (dip followed by rise), inductive (spike followed by dip), and impedance mismatch (step change).
Interpreting the TDR Waveform for Reflection Measurement
When analyzing signal reflection on a PCB due to improper termination, four typical cases are observed in time-domain reflectometry (TDR):
Multiple Discontinuities – Each bump corresponds to a specific location; use time-to-distance conversion to pinpoint the physical location on the PCB.
Open-Circuited Line – A large positive pulse appears at the round-trip time; use the amplitude to calculate Ztrace=Z0⋅1−ρ1+ρ.
Shorted Line – A large negative pulse appears.
Mismatched Load – A small positive or negative reflection appears.
Advanced TDR Techniques for Transmission Line Reflection Measurement
Differential TDR (TDT) for Reflection Measurement
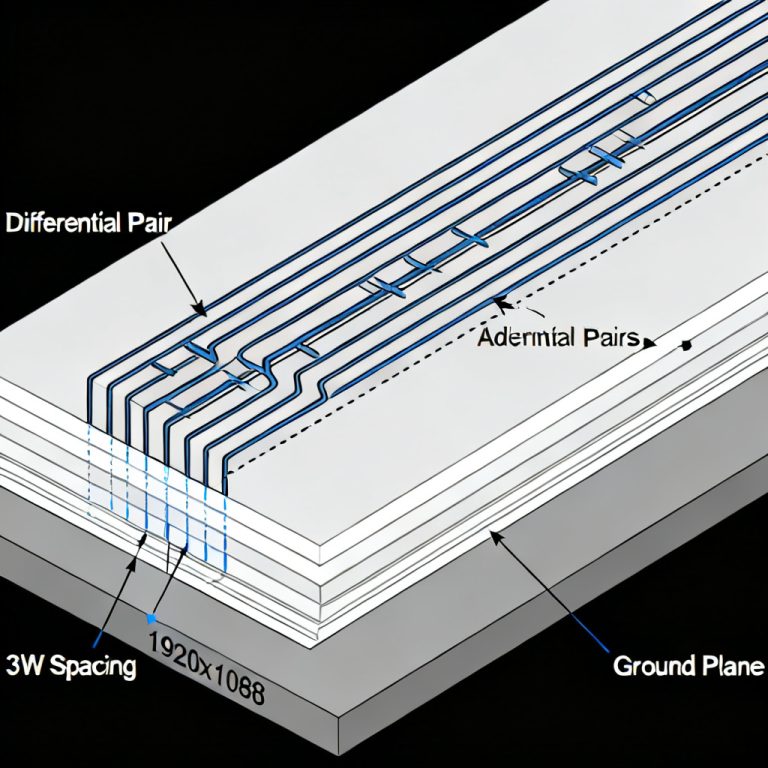
For differential pairs (e.g., USB 3.0, HDMI, PCIe), measure both odd-mode impedance and common-mode impedance. Use a differential TDR probe (GSGSG configuration). The odd-mode impedance (Z_odd) should match the target differential impedance (e.g., 100 Ω differential → Z_odd = 50 Ω per line).
Time Domain Transmission (TDT) for Reflection Measurement
TDT measures the pulse after it passes through the DUT, providing information about insertion loss, crosstalk, and signal propagation delay. Connect the TDR source to one end and a second sampling head to the far end, then compare input and output pulse shapes.
Gating and Windowing for TDR Reflection Measurement
Use a gating function in the TDR software to isolate a specific section of the trace. For example, gate out the connector region to focus only on the microstrip line, improving measurement accuracy by removing unwanted reflections from the fixture.
Common Sources of Reflection on PCB Transmission Lines
Impedance Discontinuities Causing Reflection
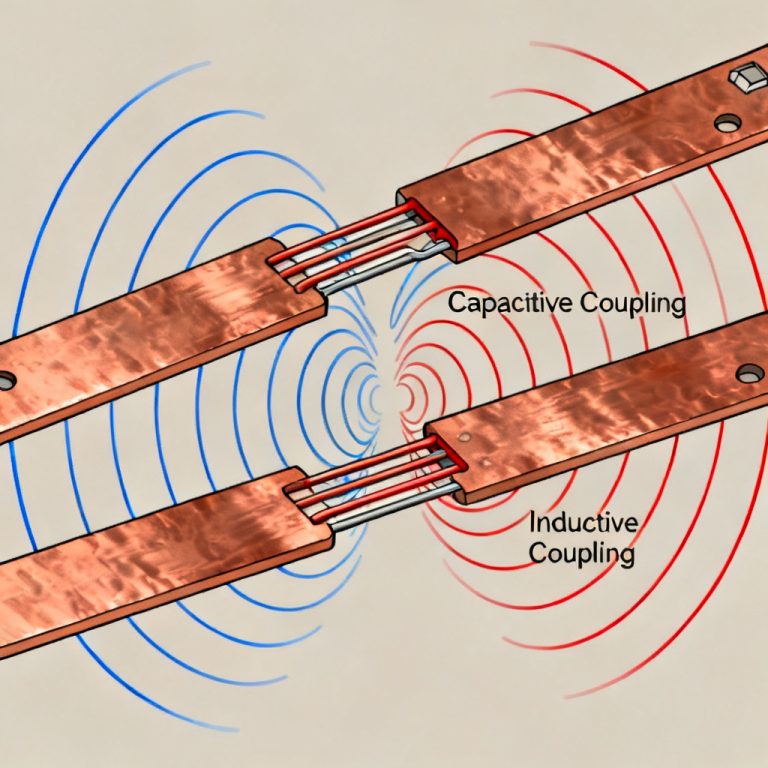
Trace width changes (even 10% variation can cause measurable reflection), via stubs (mitigate by back-drilling or using blind vias), and right-angle bends (use chamfered or mitered bends for high-speed signals).
Connector and Launch Effects on Reflection
SMA connector pad capacitance can cause a dip in the TDR trace – optimize by reducing pad size or using a ground-plane cutout. A cold solder joint adds inductance – always inspect joints under a microscope.
Material and Manufacturing Variations Affecting Reflection
Dielectric constant variation in FR-4 (±10% across a panel), etching undercut (narrows traces, increasing impedance), and glass weave effect (use spread-glass or low-loss laminates for 10+ Gbps designs).
Troubleshooting with TDR: Real-World Examples
Case 1: High-Speed USB 3.0 Trace Fails Compliance – TDR revealed a 42 Ω impedance dip at 3.5 cm from the connector due to a ground-plane split. Fix: Add a stitching capacitor or reroute. Case 2: RF Antenna Feed Line Has High VSWR – TDR showed a 15 Ω impedance step at the via transition due to small via diameter. Fix: Increase via diameter and add ground vias. Case 3: DDR4 Memory Bus Has Data Errors – TDR showed different impedance profiles per board due to prepreg supplier variation. Fix: Require impedance-controlled laminates and 100% TDR testing.
Best Practices for Accurate TDR Reflection Measurement
1. Use a calibration reference plane at the probe tip. 2. Keep the probe ground short (<2 mm). 3. Average multiple acquisitions (64 averages reduces noise by 8×). 4. Temperature stabilize the PCB (measure at 25°C ±2°C). 5. Document the setup including cable type, calibration date, and rise time.
FAQ: Measuring Reflection in Transmission Line Using TDR
What is the principle of TDR for transmission line reflection measurement?
TDR sends a fast-rise-time pulse into the transmission line and measures the reflected signal to identify impedance discontinuities. The reflection coefficient ρ = (Z_DUT – Z₀) / (Z_DUT + Z₀) quantifies the mismatch.
How do I calibrate TDR for accurate reflection measurement?
Perform a full open/short/load calibration at the probe tip to remove systematic errors from cables and adapters. Always use a known 50 Ω reference load for self-calibration first.
What are common sources of reflection in high-speed PCB transmission lines?
Common sources include trace width changes, via stubs, right-angle bends, connector pad capacitance, solder joint inductance, and material variations like dielectric constant fluctuation and etching undercut.
How do I interpret TDR waveforms for reflection measurement?
A positive pulse indicates higher impedance (open circuit), a negative pulse indicates lower impedance (short circuit), and step changes indicate impedance mismatches. Multiple bumps correspond to multiple discontinuities along the trace.
What is the difference between TDR and TDT for reflection measurement?
TDR measures the reflected signal from the input end, while TDT measures the transmitted signal at the far end. TDT provides information about insertion loss, crosstalk, and propagation delay.
Comparison: TDR vs. VNA for Reflection Measurement
| Parameter | TDR for Transmission Line Reflection | VNA for Transmission Line Reflection |
|---|---|---|
| Measurement Domain | Time domain | Frequency domain |
| Resolution | High (sub-mm with fast rise time) | Depends on frequency range |
| Ease of Use | Intuitive waveform interpretation | Requires S-parameter expertise |
| Best For | Locating physical discontinuities | Broadband impedance characterization |
Glossary of Terms for TDR Reflection Measurement
Time Domain Reflectometry (TDR): A measurement technique that uses reflected pulses to characterize impedance along a transmission line.
Reflection Coefficient (ρ): The ratio of reflected voltage to incident voltage at a discontinuity.
Characteristic Impedance (Z₀): The impedance a transmission line presents to a propagating signal, typically 50 Ω for PCB applications.
Impedance Discontinuity: Any change in characteristic impedance along a transmission line that causes signal reflection.